January 7, 2022
Nursing is one of the most important professions, and interest in the career path is high. According to Niche, Nursing was the second most common major among colleges graduates in 2019. On top of the recent college grads, there are also nearly three million registered nurses currently employed in the United States.
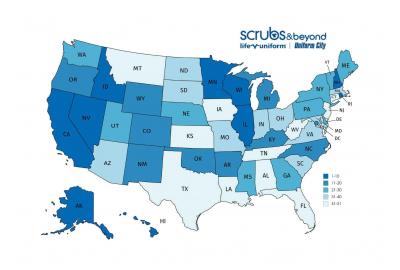
With so many recent college grads searching for their first job and likely some experienced nurses looking for a change of scenery, we wanted to know where the best job opportunities are. After some number crunching, we’ve come to an answer. These are the best states for nurses, and he’s a quick look at the top 10:
Calculating the Best States for Nurses
To determine which states are the best for nurses, we leveraged Bureau of Labor Statistics data from the latest release of the Occupational Employment Statistics program. Looking specifically at outcomes for registered nurses, each state was reviewed across three categories: compensation, market demand, and market trends.
- Compensation: The average amount of disposable income, adjusted for cost of living. The higher the better.
- Market Demand: Total employment (number of jobs) and jobs per 1,000 (indication of the importance of the role in the state). Larger numbers indicate more job opportunity.
- Market Trends:Year-over-year income growth, total employment growth, and jobs per 1,000 growth. The larger the growth the better.
Next, we ranked every state (and DC) 1-51 for each of the six metrics above. Finally, we averaged the six rankings and the state with the best average outcome across all the metrics was named the best state for nurses. Don’t see your state in the top 10 above? Keep reading to see the full rankings below.
1. California

- Adjusted Disposable Income: $80,806
- Total Employment: 294,510
- Nursing Jobs per 1,000: 17.32
- YoY Income Growth: 4.14%
- YoY Employment Growth: 4.33%
- YoY Jobs per 1,000 Growth: 2.41%
California takes the crown on this one as the best state for nurses in 2020. The state ranked number one for adjusted disposable income and total employment, making it a great destination for nurses hoping to find a job and earn a good living doing so. California also ranked second in income growth over the last couple years, boding well for the future.
2. Wisconsin

- Adjusted Disposable Income: $51,490
- Total Employment: 59,030
- Nursing Jobs per 1,000: 20.72
- YoY Income Growth: 3.28%
- YoY Employment Growth: 5.52%
- YoY Jobs per 1,000 Growth: 4.65%
Wisconsin finishes a close second, driven primarily by the state’s top five finish in both total employment growth and jobs per 1,000 growth. This suggests that there are plenty of job opportunities and the importance of the profession in the state is growing as well. To put the icing on the cake, Wisconsin also finished near the top 10 for income growth as well.
3. Rhode Island

- Adjusted Disposable Income: $56,598
- Total Employment: 12,630
- Nursing Jobs per 1,000: 26.21
- YoY Income Growth: 2.31%
- YoY Employment Growth: 6.85%
- YoY Jobs per 1,000 Growth: 5.54%
Rhode Island impressed as well, finishing as the second-best state in the country for jobs per 1,000 growth. This is a good sign that the importance of the role is on the rise relative to other jobs in the state. The Ocean State also finished third in total employment growth with a 6.85% increase year-over-year, much higher than the national average of 1.59%. Bottom line? Market trends are very favorable for nurses looking for jobs here.
4. Illinois

- Adjusted Disposable Income: $51,556
- Total Employment: 129,400
- Nursing Jobs per 1,000: 21.60
- YoY Income Growth: 2.50%
- YoY Employment Growth: 5.12%
- YoY Jobs per 1,000 Growth: 4.01%
Next up we have the Land of Lincoln. Illinois has strong numbers across the board, finishing no lower than the top half for any of our metrics. Every state has its strengths, however, and Illinois is no exception. With fifth place ranks in both employment growth and jobs per 1,000 growth, the market trends are looking great here as well.
5. Minnesota

- Adjusted Disposable Income: $58,231
- Total Employment: 69,000
- Nursing Jobs per 1,000: 24.06
- YoY Income Growth: 1.78%
- YoY Employment Growth: 6.91%
- YoY Jobs per 1,000 Growth: 5.81%
Minnesota rounds out our top 5 best states for nurses, and there’s an argument to be made that this may be the best destination we’ve covered so far. The state ranks first in jobs per 1,000 growth, second in total employment growth, and tenth in disposable income. That’s a great recipe for success, if you ask us.
6. New Hampshire

- Adjusted Disposable Income: $50,321
- Total Employment: 13,630
- Nursing Jobs per 1,000: 20.88
- YoY Income Growth: 3.88%
- YoY Employment Growth: 3.34%
- YoY Jobs per 1,000 Growth: 2.86%
New Hampshire’s high placement may come as a surprise, but what if we told you that the state ranks fifth in the nation in year-over-year income growth? That’s not a bad place to start if you’re trying to attract talent. Round it out with top 15 finishes in employment growth and jobs per 1,000 growth and New Hampshire solidifies itself as a strong up-and-comer.
7. Nevada

- Adjusted Disposable Income: $65,065
- Total Employment: 22,560
- Nursing Jobs per 1,000: 16.74
- YoY Income Growth: 0.75%
- YoY Employment Growth: 7.12%
- YoY Jobs per 1,000 Growth: 4.19%
Nevada holds the prestigious distinction of being the fastest growing market for nursing jobs over the past couple years. With a year-over-year growth rate of 7.12%, the state is a great destination for anyone looking for a job. On top of that, Nevada placed sixth in disposable income. If the jobs are there and the money is good, the nurses will come.
8. Hawaii

- Adjusted Disposable Income: $70,771
- Total Employment: 11,310
- Nursing Jobs per 1,000: 17.63
- YoY Income Growth: 1.12%
- YoY Employment Growth: 4.72%
- YoY Jobs per 1,000 Growth: 3.26%
The Aloha State is objectively one of the most beautiful places to live, and the good news for nurses is it pays pretty well, too. Disposable income adjusted for cost of living is $70,771 per year, which ranks second in the country. Market trends are strong as well, as the state earned a spot in the top 10 for both employment growth and jobs per 1,000 growth.
9. Alaska
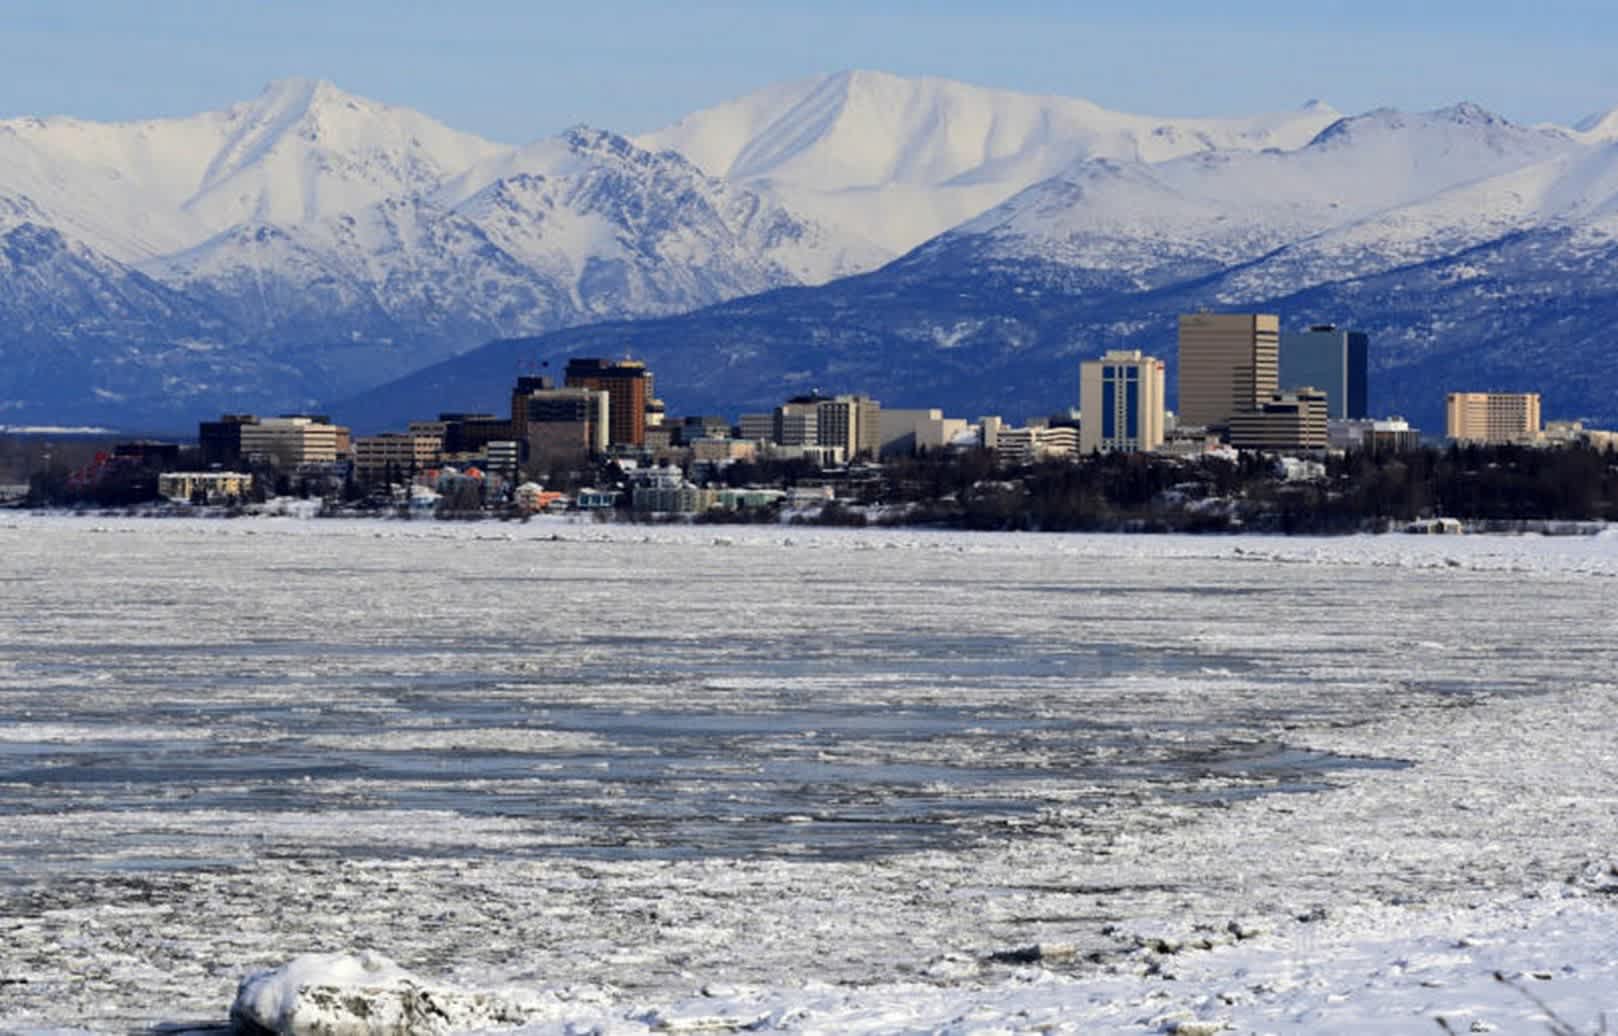
- Adjusted Disposable Income: $65,773
- Total Employment: 5,730
- Nursing Jobs per 1,000: 18.17
- YoY Income Growth: 2.06%
- YoY Employment Growth: 2.87%
- YoY Jobs per 1,000 Growth: 3.82%
Taking a sharp detour up north, we come to Alaska. As its unofficial nickname suggests, “The Last Frontier” will require a big commitment for nurses looking to move there, but those that do will be rewarded with over $65,000 in disposable income (5th) as well as strong market trends to the tune of a 3.82% year-over-year increase in jobs per 1,000 (6th).
10. Idaho

- Adjusted Disposable Income: $47,989
- Total Employment: 13,790
- Nursing Jobs per 1,000: 19.53
- YoY Income Growth: 4.01%
- YoY Employment Growth: 3.53%
- YoY Jobs per 1,000 Growth: 0.49%
Rounding out our top 10 is Idaho. Perhaps a somewhat surprising entry simply because the state doesn’t typically come to mind as a hot job market, nurses here are enjoying 4.01% year-over-year income growth (4th) in addition to growth in the total job market for nurses (14th). These factors make it a great, under-the-radar candidate for any nurse on the job hunt.
Summary Stats
|
Rank |
State |
Adjusted Disposable Income |
Total Employment |
Nursing Jobs per 1,000 |
Year-over-year Income Growth |
Year-over-year Employment Growth |
Year-over-year Jobs per 1,000 Growth |
|---|---|---|---|---|---|---|---|
|
1 |
California |
$80,806 |
294,510 |
17.32 |
4.14% |
4.33% |
2.41% |
|
2 |
Wisconsin |
$51,490 |
59,030 |
20.72 |
3.28% |
5.52% |
4.65% |
|
3 |
Rhode Island |
$56,598 |
12,630 |
26.21 |
2.31% |
6.85% |
5.54% |
|
4 |
Illinois |
$51,556 |
129,400 |
21.60 |
2.50% |
5.12% |
4.01% |
|
5 |
Minnesota |
$58,231 |
69,000 |
24.06 |
1.78% |
6.91% |
5.81% |
|
6 |
New Hampshire |
$50,321 |
13,630 |
20.88 |
3.88% |
3.34% |
2.86% |
|
7 |
Nevada |
$65,065 |
22,560 |
16.74 |
0.75% |
7.12% |
4.19% |
|
8 |
Hawaii |
$70,771 |
11,310 |
17.63 |
1.12% |
4.72% |
3.26% |
|
9 |
Alaska |
$65,773 |
5,730 |
18.17 |
2.06% |
2.87% |
3.82% |
|
10 |
Idaho |
$47,989 |
13,790 |
19.53 |
4.01% |
3.53% |
0.49% |
|
11 |
Michigan |
$51,457 |
96,680 |
22.39 |
3.20% |
2.75% |
1.76% |
|
12 |
Colorado |
$51,096 |
51,760 |
19.75 |
2.30% |
4.90% |
2.29% |
|
13 |
New Mexico |
$51,815 |
16,730 |
20.61 |
2.71% |
2.70% |
1.37% |
|
14 |
Arkansas |
$41,894 |
25,380 |
20.98 |
3.35% |
4.10% |
3.24% |
|
15 |
Wyoming |
$47,096 |
5,010 |
18.60 |
3.79% |
2.04% |
1.48% |
|
16 |
Oregon |
$68,705 |
36,020 |
19.10 |
2.60% |
2.50% |
-0.52% |
|
17 |
North Carolina |
$44,375 |
102,500 |
23.38 |
3.66% |
3.32% |
1.31% |
|
18 |
Oklahoma |
$43,801 |
29,330 |
18.40 |
2.34% |
4.75% |
3.35% |
|
19 |
Kentucky |
$44,151 |
46,130 |
24.41 |
2.55% |
3.87% |
3.12% |
|
20 |
District of Columbia |
$61,384 |
11,110 |
15.60 |
2.49% |
1.00% |
0.36% |
|
21 |
Georgia |
$47,181 |
76,640 |
17.44 |
3.30% |
2.19% |
0.07% |
|
22 |
Delaware |
$52,407 |
11,840 |
26.40 |
2.21% |
1.89% |
0.58% |
|
23 |
New York |
$59,266 |
182,490 |
19.44 |
2.59% |
1.29% |
-0.63% |
|
24 |
Pennsylvania |
$49,497 |
148,520 |
25.40 |
0.82% |
3.77% |
2.59% |
|
25 |
Maine |
$46,758 |
14,460 |
23.89 |
2.61% |
1.83% |
0.76% |
|
26 |
Utah |
$45,423 |
21,700 |
14.91 |
4.16% |
1.69% |
-1.45% |
|
27 |
Washington |
$58,397 |
56,290 |
17.27 |
3.58% |
-1.04% |
-3.24% |
|
28 |
Vermont |
$46,905 |
6,460 |
21.16 |
-0.58% |
3.03% |
3.00% |
|
29 |
Mississippi |
$39,051 |
29,860 |
26.57 |
1.37% |
3.82% |
3.42% |
|
30 |
Nebraska |
$44,949 |
22,970 |
23.48 |
3.63% |
0.44% |
-0.37% |
|
31 |
Massachusetts |
$66,664 |
80,630 |
22.58 |
3.15% |
-2.70% |
-3.88% |
|
32 |
Maryland |
$50,352 |
54,080 |
20.15 |
2.09% |
0.71% |
-0.02% |
|
33 |
Virginia |
$44,796 |
64,750 |
16.89 |
2.65% |
0.76% |
-0.37% |
|
34 |
Arizona |
$56,172 |
54,690 |
19.60 |
2.52% |
0.11% |
-2.96% |
|
35 |
South Carolina |
$44,676 |
44,350 |
21.51 |
2.06% |
2.66% |
0.03% |
|
36 |
Indiana |
$45,235 |
67,870 |
22.27 |
3.86% |
-0.96% |
-1.92% |
|
37 |
South Dakota |
$39,390 |
12,760 |
30.21 |
2.33% |
1.84% |
1.12% |
|
38 |
North Dakota |
$45,649 |
8,770 |
21.07 |
4.12% |
-2.77% |
-2.70% |
|
39 |
Missouri |
$45,618 |
71,770 |
25.59 |
2.89% |
-0.44% |
-1.03% |
|
40 |
Ohio |
$47,404 |
125,380 |
23.15 |
2.02% |
0.61% |
-0.24% |
|
41 |
Tennessee |
$41,689 |
60,360 |
20.41 |
2.11% |
1.70% |
0.28% |
|
42 |
Iowa |
$39,922 |
33,770 |
21.90 |
2.07% |
1.47% |
1.05% |
|
43 |
Alabama |
$39,625 |
49,490 |
25.46 |
2.73% |
0.41% |
-0.68% |
|
44 |
Montana |
$47,413 |
10,100 |
21.80 |
1.77% |
-0.10% |
-0.64% |
|
45 |
New Jersey |
$57,669 |
79,530 |
19.64 |
0.90% |
-1.28% |
-2.33% |
|
46 |
Texas |
$51,940 |
210,350 |
17.36 |
1.14% |
-0.89% |
-2.71% |
|
47 |
Connecticut |
$58,086 |
31,400 |
18.91 |
1.27% |
-8.48% |
-8.82% |
|
48 |
Florida |
$43,987 |
177,600 |
20.63 |
2.03% |
-0.41% |
-2.60% |
|
49 |
West Virginia |
$42,586 |
19,930 |
28.61 |
2.32% |
-2.35% |
-3.49% |
|
50 |
Kansas |
$41,563 |
27,810 |
20.22 |
1.82% |
-3.77% |
-4.21% |
|
51 |
Louisiana |
$43,862 |
43,110 |
22.53 |
0.65% |
-6.22% |
-6.79% |
Closing Thoughts
That wraps things up for the top 10 best states for nurses. There are tons of great job markets for nurses throughout the country, including a few surprises. It’s all about finding the right combination of factors that work for you.
Looking for a new set of scrubs? Check out our selection or shop by color.
Want to read more articles like this? Check out our blog for helpful tips and research.
Sources
- Bureau of Labor Statistics. “Occupational Employment Statistics.” https://www.bls.gov/oes/. 5 December 2019.
- Massachusetts Institute of Technology. “Living Wage Calculator.” mit.edu. 5 December 2019.